


Complexity and redundancy of reports.
Standard reports, presented in the form of tables and graphs, often turn out to be complex to understand. Analyzing them requires time and knowledge in the specifics of the process. This can cause misunderstanding and unnecessary complexity. Imagine a tabular report with many columns and rows, full of numbers and letters. Understanding what's happening can be difficult, especially for newcomers to the team.Solution: Automated reporting tool in Oki-Toki display information in understandable language. You'll no longer be confused by numbers and columns. Instead, you get a clear and concise report on the current situation.
The inability to consolidate data from different sources.
Another problem with standard reports is the lack of ability to consolidate data from different parts of your system. For example, information on sales, agent workload, and communications may be located in different places. This requires manual downloading and summarizing data, which often leads to errors. For instance, you want to see how the number of calls affects the performance of agents. For this, you need to first download data on calls, then data on agent work, and finally, compare them in Excel. This takes a lot of time and may lead to errors in matching.Solution: Oki-Toki reports that automated reporting software consolidate data. Supervisors won't need to spend time manually consolidating reports. All the necessary information is available in one place.
Difficulties in providing information to customers.
Often, customers require regular reports on the operation of your call center. Oki - Toki provides reports automation emailing, simplifying interaction with customers. For example, a project client wants to receive daily reports on the number of processed calls. You do this manually every day, sending reports by mail. This takes time and can cause difficulties if you forget to send a report.Solution: Reporting automation tools in Oki-Toki allow setting up regular emailing of reports to the client's email. You choose the frequency and format of the reports, and the system does all the work for you. Forgetting to send a report is no longer a fear.
Functionality of reports in Oki-Toki
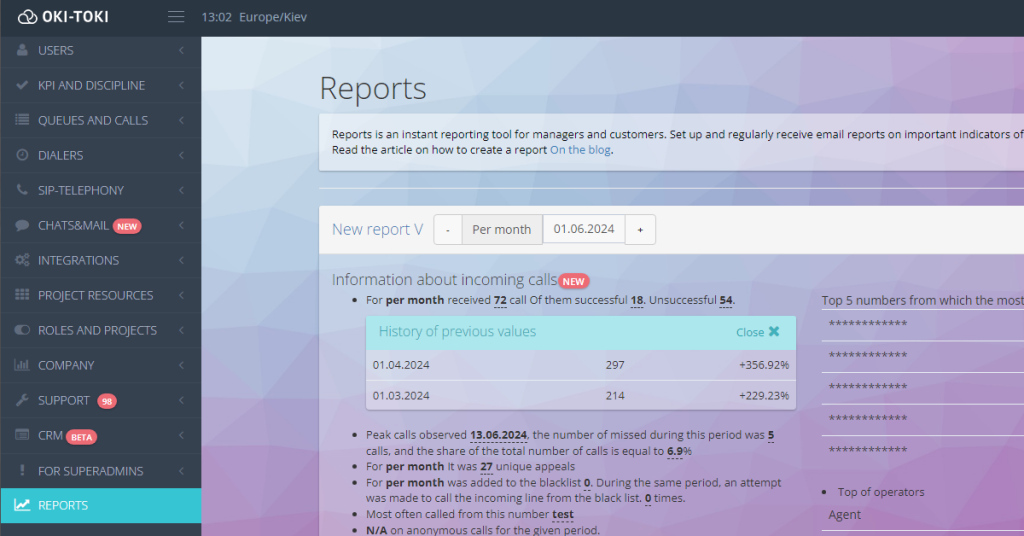
Let's take a closer look at the functionality of automated client reporting and their specific benefits with examples.Displaying information in understandable language
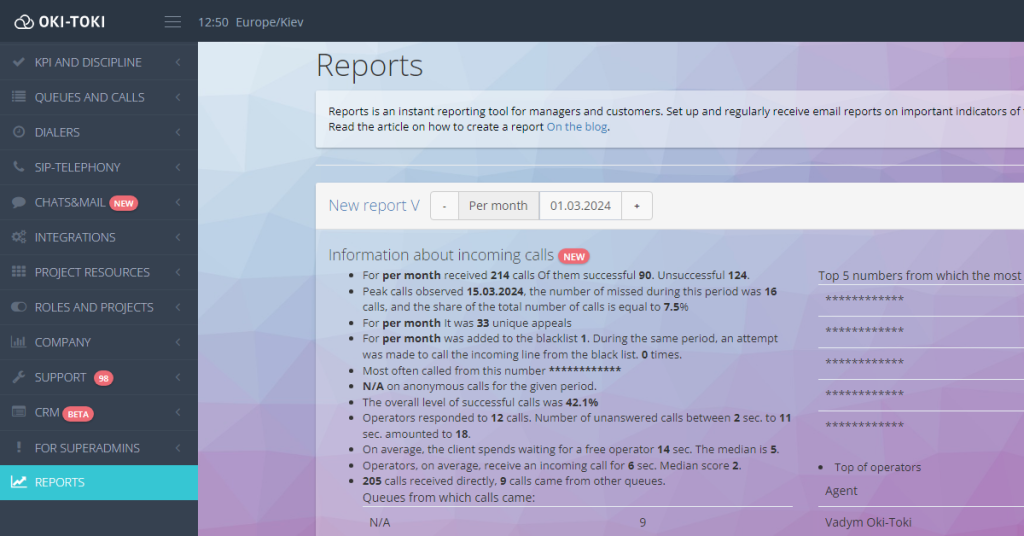
One of the key features of automatic reports in Oki-Toki is their ability to present information in understandable language. Forget about complex tables and graphs that can cause misunderstanding. Instead, automatic reporting provide you with a clear and concise analysis of the current situation in your project.Example: For instance, imagine you receive an automated report generator on your team of agents. Instead of a mass of numbers and statistics, the report gives you the following simple and understandable text:: “Processed XXX calls, which is 20% more than in the previous period. Tops of the best and worst agents by various indicators.”
Choosing necessary sections and KPIs
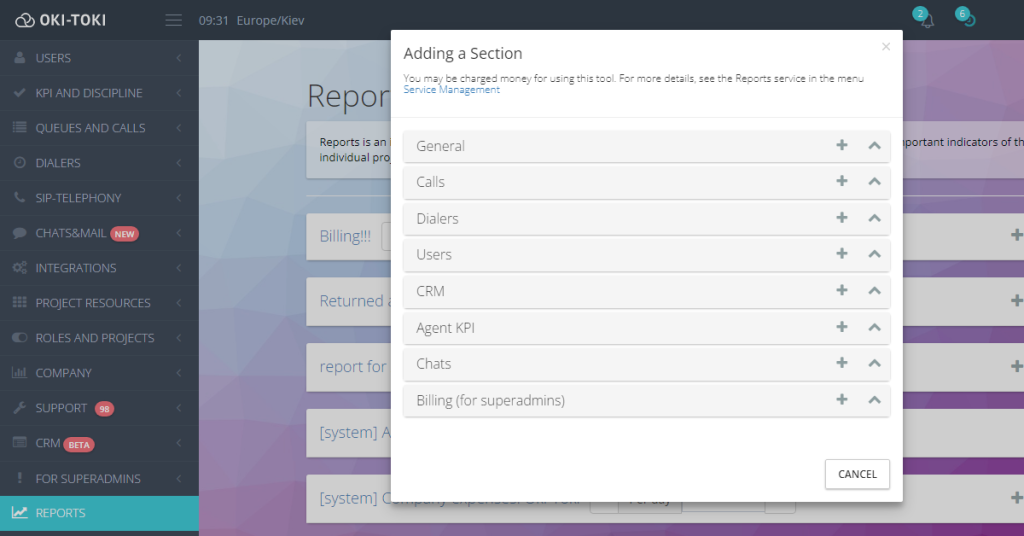
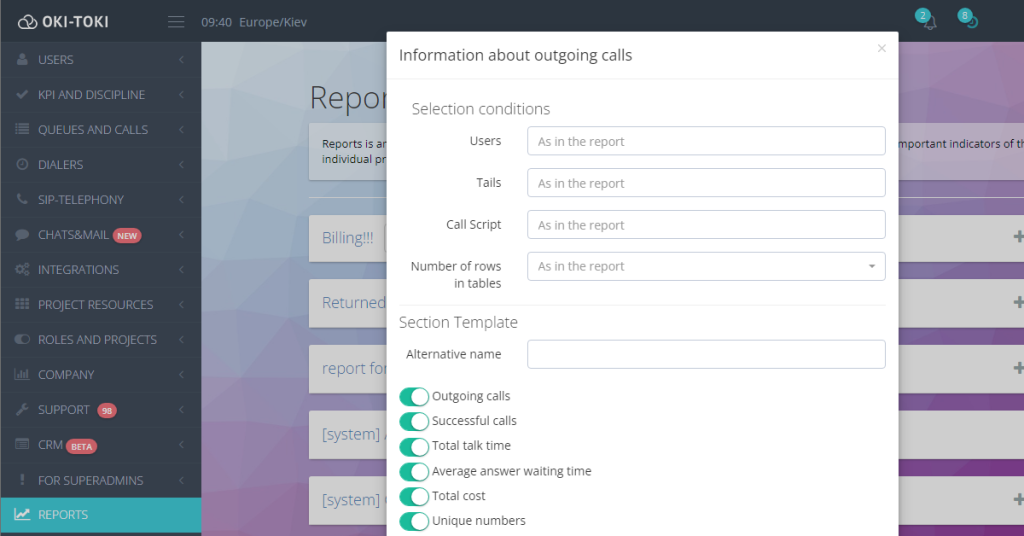
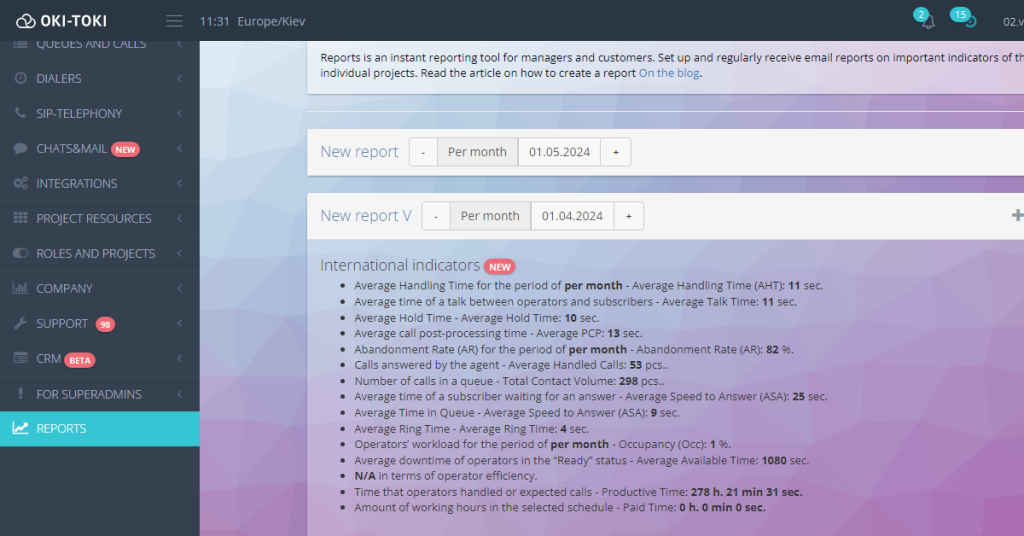
Another important capability of automatic reports is their customizability. You can choose the necessary sections of the report and key performance indicators (KPIs) according to your needs.Example: You want to track the efficiency of your call center. You need to include in the report the following sections: “Dialer operation”, “Details about incoming and outgoing calls”, “Statistics of Business Processes”, “International Indicators”, “KPI Standards”.
Regular emailing
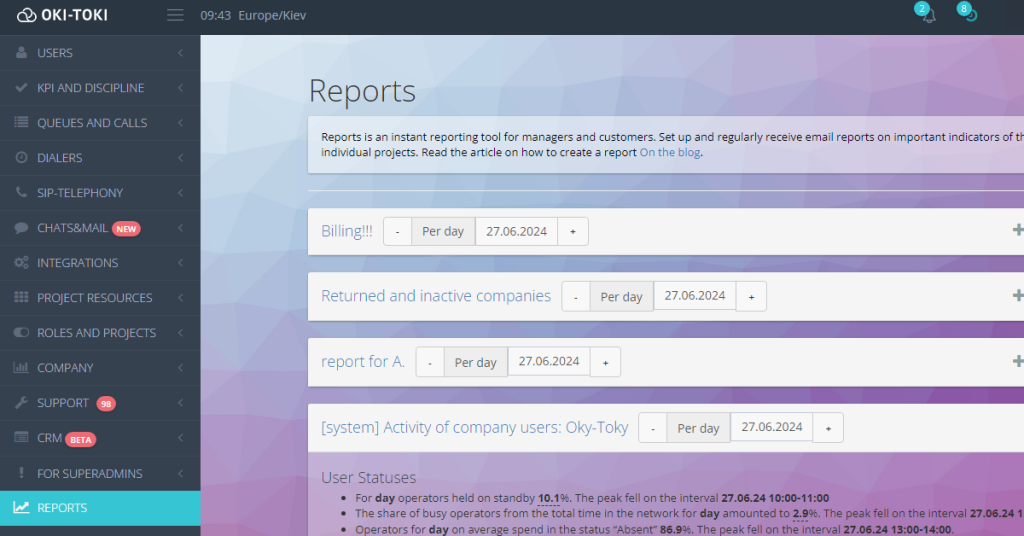
Another advantage of reports from Oki-Toki is the setup for emailing reports to you. You choose the sending frequency - every hour, day, week, or month - and the reports will be delivered to you automatically.Example: You want to receive daily reports on the number of calls received at your online store. You set up an automatic report for daily mailing. Now you have up-to-date information every day without the need for daily requests.
Studying the dynamics of changes in key indicators
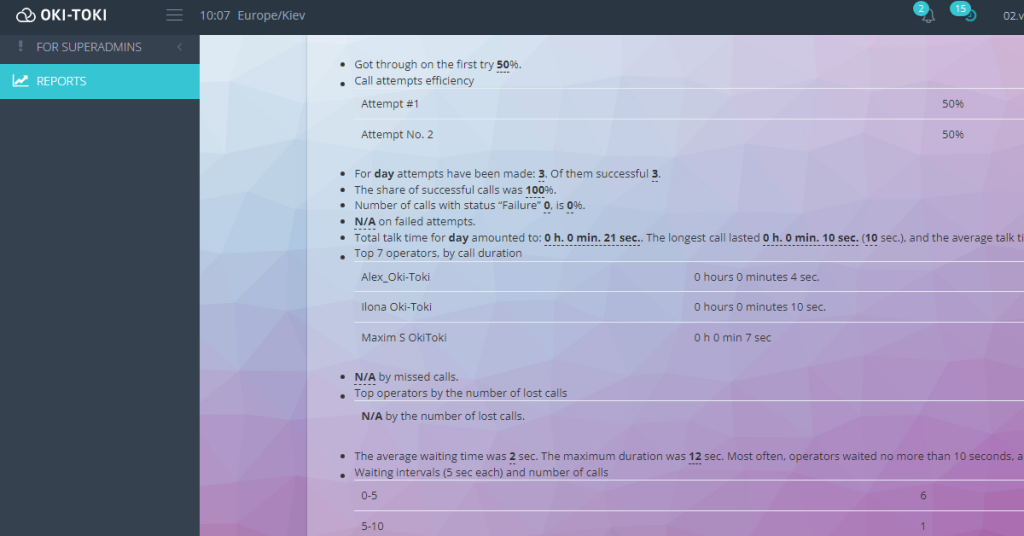
With reports, it's easier to analyze the dynamics of changes in important call center indicators. You can track which KPIs are improving and which require attention and improvement.Example: You have set up a monthly report on your team's performance. Comparing the data for the last quarter, you noticed that the customer waiting time increased in the last month. This means that there might be more customers and your company lacks agents, so measures can be taken to improve this indicator.
Creating your own reports
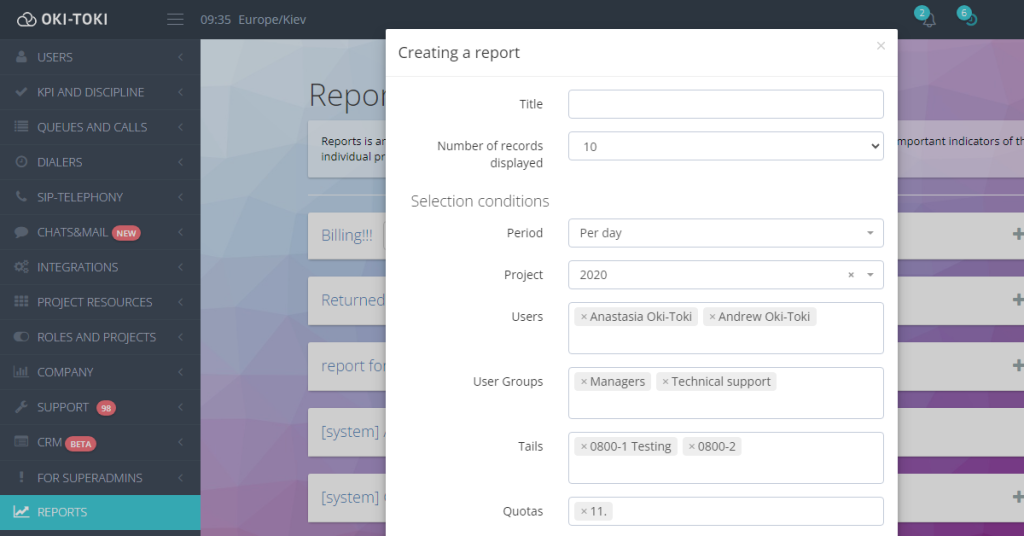
Last but not least, the ability to create your own reports by gathering only the information you truly need is a significant advantage. In Oki-Toki, you can customize reports to meet your specific goals and tasks.Example: You need to create a special report for your CEO that will display only key financial indicators. You select the necessary sections: “Queue activity data”, “International indicators”, “Costs in Oki - Toki”, “API Usage”, and “KPI” and create an individual report that will help your management make decisions based on the obtained data.
Iulia Raiscaia
Bogdan Koshevyy
Love
Guest